



On August 27, 2026, Bitcoin’s daily RSI stood at 81.71 points, deep in overbought territory. Yet at the same time, the MACD showed powerful bullish momentum, with a line value of 4118.2 versus a signal line of 2830.18 [12]. Two indicators, two completely different messages. This exact tension is what makes technical analysis of cryptocurrency so demanding, and so valuable for anyone who wants to go beyond simply buying and holding.
If you already know how to set up a wallet or trade on an exchange, you’ve mastered the basics. The next step is learning to read price charts yourself: spotting patterns, combining indicators, and controlling risk. This article walks through the most important tools of advanced crypto technical analysis, with concrete examples from the current 2026 market.
Table of Contents
Key Takeaways
- Chart patterns like head and shoulders, double top/bottom, and triangles help spot potential trend reversals or continuations early.
- RSI and MACD often deliver conflicting signals, combining them is essential for sound decisions.
- Moving averages (SMA, EMA) and Bollinger Bands reveal trend direction and volatility.
- Volume confirms or invalidates every chart signal, without volume confirmation, any pattern is questionable.
- Risk management with stop-loss orders, position sizing, and a clear risk-reward ratio matters more than any single analysis.
Key Chart Patterns for Crypto Technical Analysis
Chart patterns emerge because supply and demand form recurring structures over time. They’re not random, they’re the visual result of mass psychology, greed, fear, and hesitation playing out in price action.
Head and Shoulders Formation
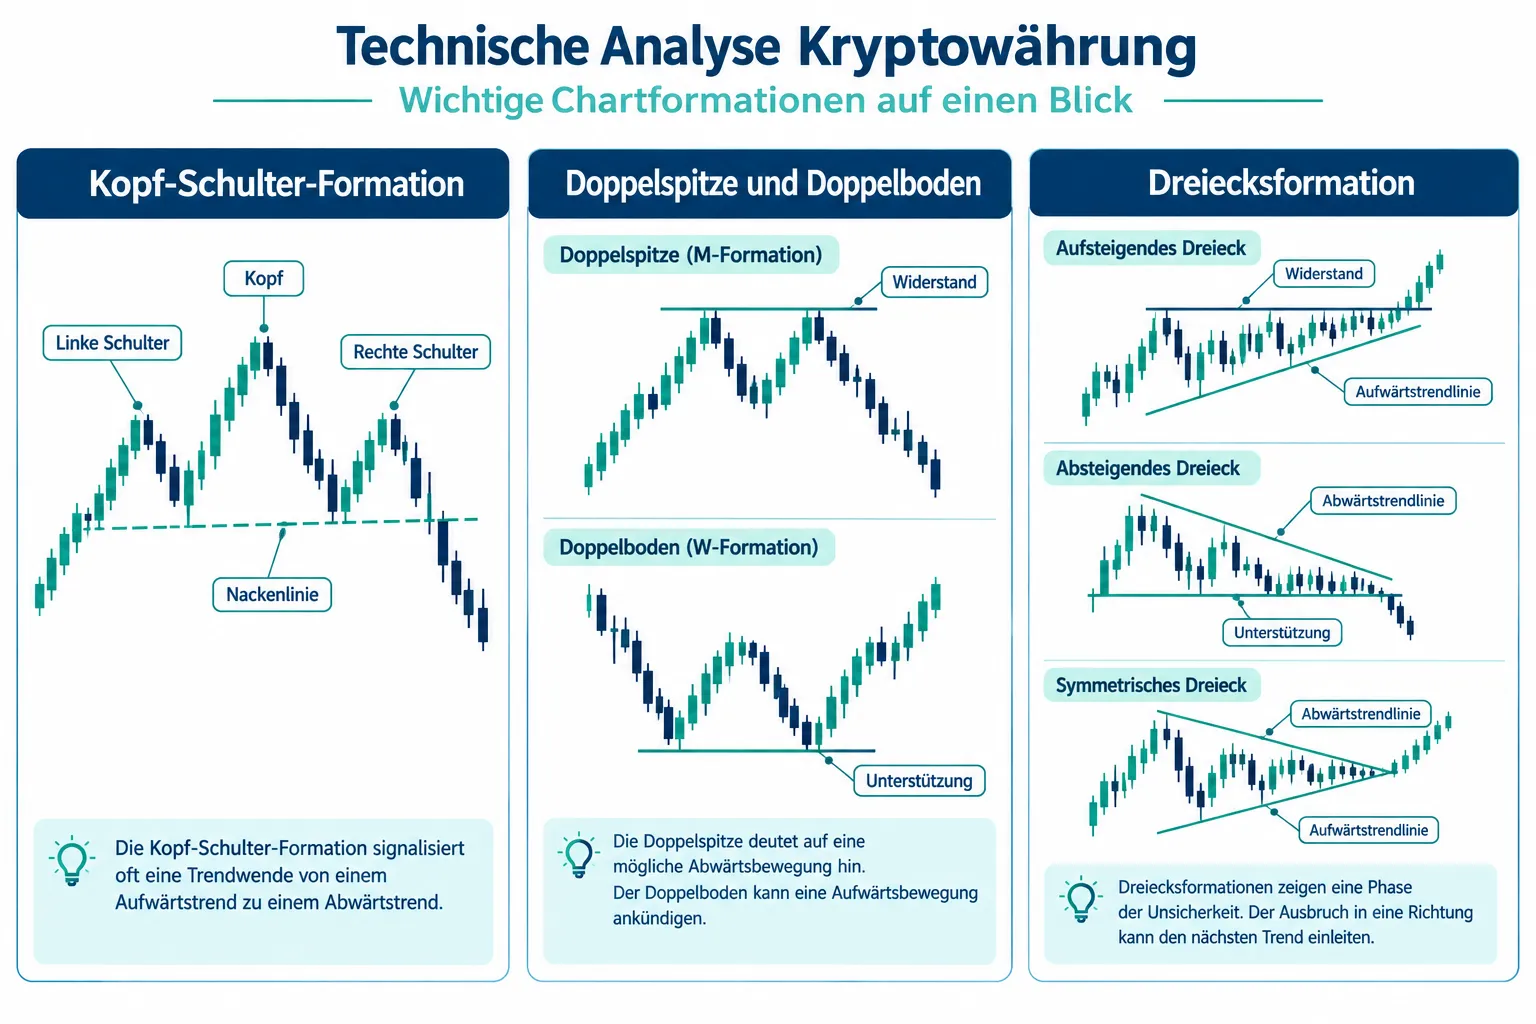
The head and shoulders formation is considered one of the most reliable reversal patterns. It consists of three peaks: a left shoulder, a higher middle peak (the "head"), and a right shoulder roughly at the same height as the left one. Connecting the two troughs between the shoulders forms what’s called the neckline. When price breaks below this line, the pattern is considered confirmed, often followed by a downward move roughly equal to the distance between the head and the neckline.
Double Top and Double Bottom
A double top forms when price fails twice at a similar resistance level, an M-shaped pattern. The double bottom is its counterpart: a W-shaped pattern with two troughs at a similar level. Both formations signal that one side of the market, buyers or sellers, has failed twice to push through, the direction. The breakout from the line in between confirms the pattern.
Triangle Formations
Triangles form when highs and lows increasingly converge:
- Ascending triangle: flat resistance line on top, rising support below, usually bullish.
- Descending triangle: flat support below, falling resistance above, usually bearish.
- Symmetrical triangle: both lines converge toward each other, the direction of the breakout determines what follows.
Market reports from late September 2026 cite concrete resistance zones for Bitcoin around $85,000 and for Ethereum around $3,000, levels like these are frequently combined with triangle or double-top patterns in advanced analysis to assess breakout and false-breakout scenarios. Our analysis of the Bitcoin rally past $85,000 walks through exactly how such a breakout played out in practice.
"A chart pattern is a probability statement, not a guarantee, it shows where the market tends to want to go, not where it must go."
Key Indicators for Crypto Technical Analysis
Indicators translate price and volume data into measurable values. They don’t replace chart patterns, they complement them, ideally several tools confirm the same conclusion.
RSI, Relative Strength Index
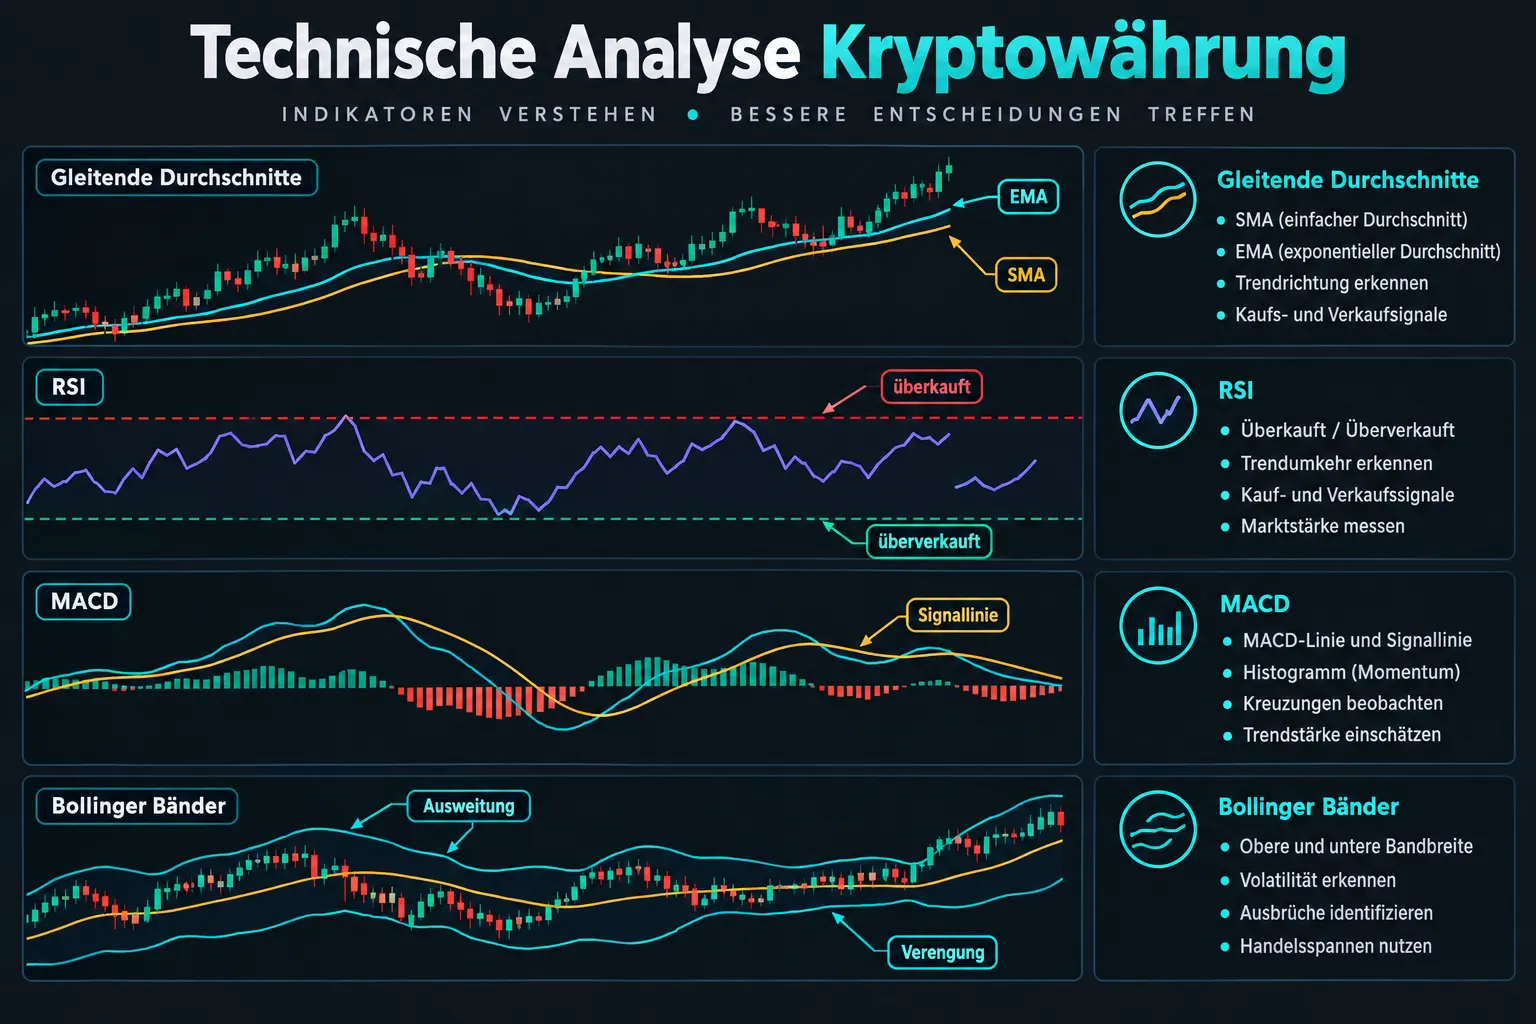
The RSI measures the speed and strength of price movements on a scale from 0 to 100. Values above 70 are classically considered overbought, values below 30 oversold [2][7]. On August 19, 2026, Bitcoin’s daily RSI14 stood at 70.99, the hourly reading even reached 85.32, a clear overheating signal. Important: in strong bull markets, the RSI can stay above 60 for weeks without a correction occurring. Advanced traders therefore distinguish between a "trend RSI" in strong trends and classic overbought signals during sideways phases.
MACD, Moving Average Convergence Divergence
The MACD consists of two lines (the MACD line and the signal line) plus a histogram representing the difference between them. When the MACD line crosses the signal line from below to above, that’s considered a bullish signal, and vice versa. A report on calendar week 30 of 2026 describes exactly this kind of setup: the daily RSI crossed upward through 58 points, accompanied by a bullish divergence in the MACD [9]. It gets interesting when RSI and MACD contradict each other: for BTC/USD on Bitfinex, the RSI14 at 55.651 showed a "buy" signal, while the MACD at −58.3 simultaneously showed "sell" [10]. Divergences like this aren’t a flaw in the indicators, they’re a sign that the market is currently searching for direction.
Moving Averages: SMA and EMA
The simple moving average (SMA) calculates the average price over a fixed period, such as 50 or 200 days. The exponential moving average (EMA) weights recent prices more heavily and therefore reacts faster to changes. In early September 2026, an analysis showed that Bitcoin, despite a slightly negative MACD, remained above its stacked 50-, 100-, and 200-day EMAs [6], a classic scenario where the long-term trend structure stays intact while short-term momentum is already fading. Standard settings for beginners are SMA 50/200, while advanced traders use shorter or longer periods depending on their timeframe [5].
Bollinger Bands
Bollinger Bands consist of a middle moving average (usually 20 periods) and two bands set two standard deviations away. They visualize volatility: narrow bands suggest a quiet market phase, often a precursor to a strong move. Wide bands signal high volatility. When price repeatedly touches the upper band, that can indicate an overbought situation, similar to a high RSI reading.
Overview of standard parameters:
| Indicator | Common setting | Meaning |
|---|---|---|
| RSI | 14 periods | Overbought (>70) / Oversold (<30) |
| MACD | 12/26/9 | Momentum and trend shifts |
| SMA/EMA | 50/200 | Long-term trend |
| Bollinger Bands | 20/2 | Volatility and extreme zones |
These values are a solid starting point for crypto technical analysis, but advanced traders adjust them to the timeframe and volatility of the specific coin [5].
Volume Analysis as Trend Confirmation
A chart pattern or indicator signal without volume confirmation is like a headline without evidence. If price rises on a breakout from a triangle or a double top accompanied by significantly elevated trading volume, that suggests a genuine market move, carried by broad participation. If volume stays low, there’s a risk of a false breakout, where price quickly returns to its prior range.
Volume also acts as a tiebreaker during RSI/MACD divergences: when price falls alongside a declining RSI and a bearish MACD crossover, paired with rising volume, as was observed for Bitcoin below the $77,000 mark in mid-September 2026 [3], that significantly strengthens the bearish signal. Without this confirmation, any chart analysis remains just a hypothesis.
Risk Management in Crypto Technical Analysis
Even the best chart analysis won’t protect you from losses if risk management is missing. Three tools are central here:
- Stop-loss orders: an automatic sell order that closes a position once a predetermined price loss is reached. It caps the maximum loss per trade and removes emotional decisions from the process.
- Position sizing: determining how much capital to risk per trade, commonly recommended at 1 to 2 percent of total capital per position. This way, a portfolio can survive a string of bad decisions.
- Risk-reward ratio: the ratio between a trade’s potential loss and potential gain. A ratio of at least 1:2, meaning twice the profit potential relative to the risk, is considered a solid baseline, even if not every trade is profitable.
Particularly in phases like late September 2026, when Bitcoin, Ethereum, and XRP developed at different strengths, while Ethereum defended the zone around $2,500, XRP consolidated below its 200-day line [6], this shows just how important consistent risk management is across different coins.
Important note: this is not financial advice. Crypto technical analysis is a tool for assessing probabilities, not a guarantee of success. Price movements can develop differently than expected despite careful analysis. Every investment decision should be based on your own research and take your personal risk profile into account.
Conclusion: Crypto Technical Analysis as a Continuous Learning Process
Chart patterns, RSI, MACD, moving averages, Bollinger Bands, and volume analysis together form a toolkit that makes price movements more tangible, but never predictable. The examples from 2026 make it clear: indicators regularly contradict each other, and that’s exactly where the real skill advanced traders need to develop lies, reading context instead of blindly following individual signals.
Anyone serious about using crypto technical analysis should start small: practice one pattern or one indicator at a time, document the results, and only combine them afterward. Risk management belongs in the process from the very start, not as an afterthought, but as a fundamental prerequisite for every trading decision. The sensible next step is to use a demo account or small position sizes to test the concepts introduced here against the real market before committing larger capital.
References
[1] Technical – https://www.investing.com/crypto/bitcoin/technical [2] coinmarketcap – https://coinmarketcap.com/de/charts/rsi/ [3] Technische Analyse Bitcoin Faellt Unter 77 000 Dollar Wie Geht Es Weiter – https://www.xtb.com/de/Marktanalysen/Trading-News/technische-analyse-bitcoin-faellt-unter-77-000-dollar-wie-geht-es-weiter [4] Technical – https://de.investing.com/crypto/bitcoin/technical [5] Technische Indikatoren – https://www.krypto-trading.com/grundlagen/technische-indikatoren/ [6] Bitcoin Ethereum Und Xrp Unter Druck Rsi Macd Signalisieren Vorsicht – https://www.it-boltwise.de/bitcoin-ethereum-und-xrp-unter-druck-rsi-macd-signalisieren-vorsicht.html [7] coinmarketcap – https://coinmarketcap.com/sv/charts/rsi/ [8] Bitcoin Kaempft Um Die Rueckkehr Zur 80 000 Dollar Marke Wie Geht Es Weiter Für Kryptowaehrungen – https://www.xtb.com/de/Marktanalysen/Trading-News/bitcoin-kaempft-um-die-rueckkehr-zur-80-000-dollar-marke-wie-geht-es-weiter-für-kryptowaehrungen [9] Bitcoin Chartanalyse Kw30 2026 – https://bitcoin-2go.de/bitcoin-chartanalyse-kw30-2026/ [10] Btc Usd Technical – https://de.investing.com/crypto/bitcoin/btc-usd-technical
Frequently Asked Questions
What does an RSI reading above 70 mean for a cryptocurrency?
A reading above 70 is classically considered overbought, though in strong bull markets it can stay elevated for weeks without a correction occurring.
Why do RSI and MACD sometimes give conflicting signals?
The two indicators measure different aspects of price action, so they can point in opposite directions; trading volume then acts as a tiebreaker.
What is the head and shoulders chart pattern?
A reliable reversal pattern made of three peaks; a break below the neckline often triggers a downward move roughly equal to the distance between the head and the neckline.
What three tools matter most for risk management in technical analysis?
Stop-loss orders, position sizing of 1 to 2 percent of capital per trade, and a risk-reward ratio of at least 1:2.