



More than a billion US dollars were wiped out of the market within 24 hours, not through a crash, but through a surge upward. Anyone who had bet on falling prices was flat-out steamrolled. The current Bitcoin rally to $87,500 is therefore more than just another price move: it exemplifies how strongly leveraged positions can catapult a market in the opposite direction in a short amount of time.
For technical decision-makers building crypto infrastructure, trading systems, or risk models, this case is a textbook lesson in market mechanics. It’s worth understanding the numbers and the causal chain precisely before translating them into dashboards, alerts, or trading logic.
Table of Contents
Key Takeaways
- Bitcoin jumped roughly 10 percent to an intraday high of $87,374, the highest level since the end of January 2026.
- More than $926 million was liquidated in 24 hours, with over 80 percent of that coming from short positions.
- US spot Bitcoin ETFs recorded net inflows of $433 million on September 18 alone, led by Fidelity’s FBTC and BlackRock’s IBIT.
- Bitcoin closed above its 50-week moving average for the first time in 45 weeks, historically a signal of a trend reversal.
- Open Interest rose 7.6 percent to $156 billion despite the liquidation wave, meaning leverage in the system is already building back up.
What Happened Overnight: Bitcoin Rally Pushes Price to a Multi-Month High
The trigger was unspectacular, the effect dramatic. Bitcoin had spent weeks trading in a tight range between $82,000 and $86,000. Exactly within that corridor, numerous short positions had accumulated, bets that the price would keep falling. When the price broke upward instead, the market’s structure flipped [1].
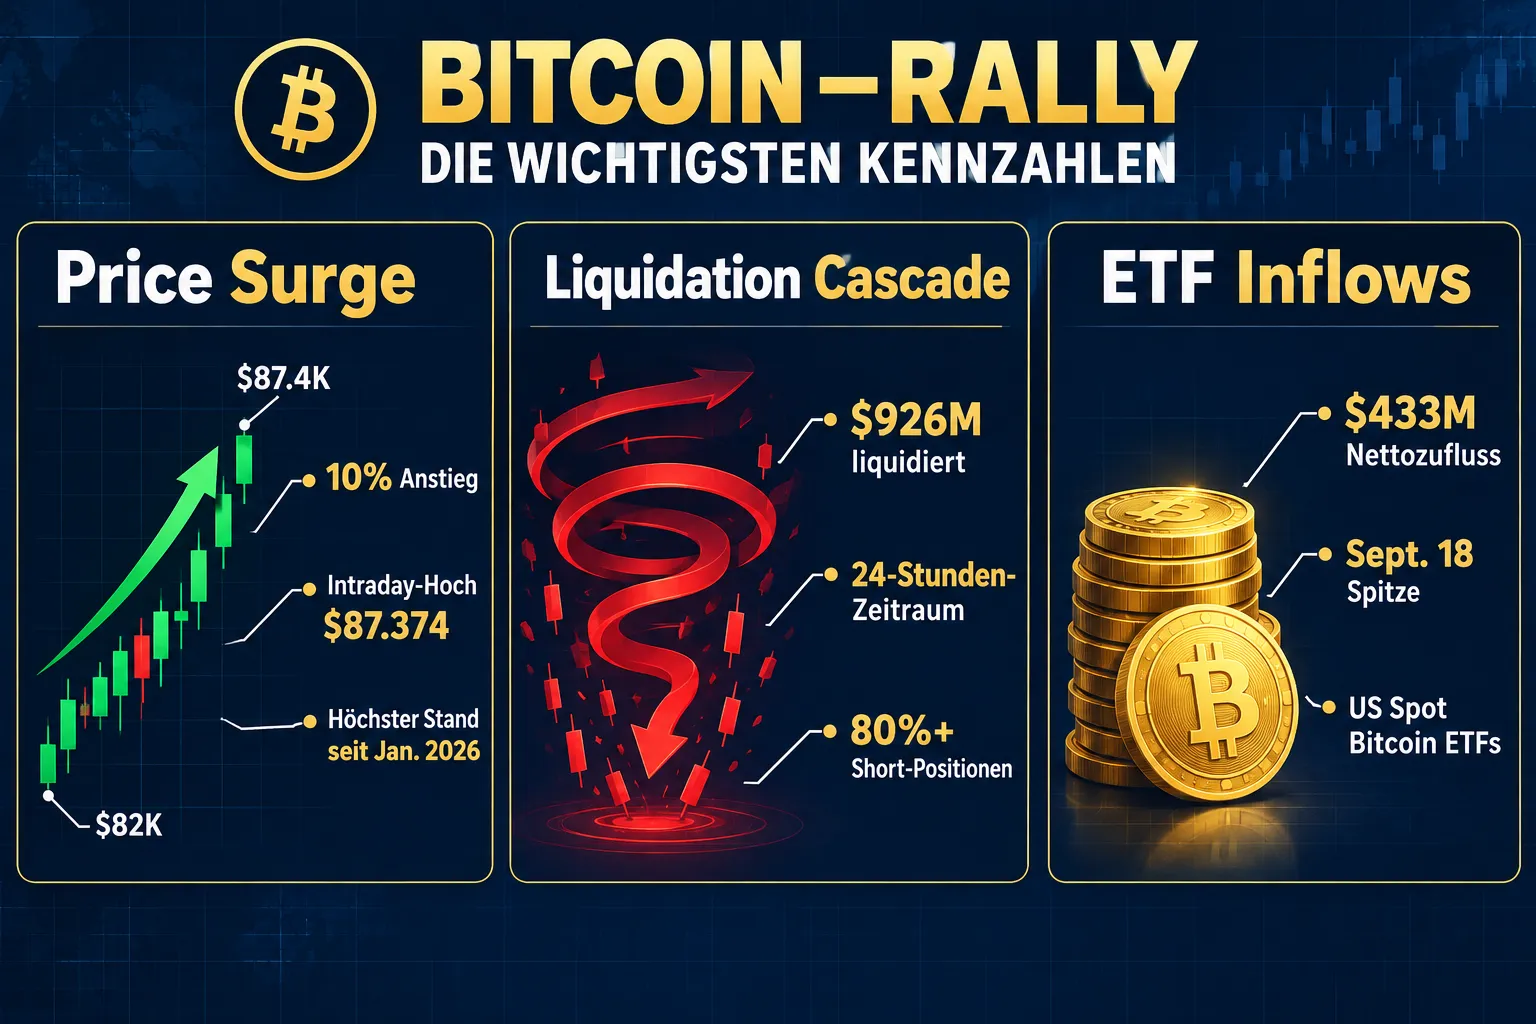
Within a short span, Bitcoin reached an intraday high of $87,374, the highest level since the end of January 2026 [3]. In parallel, traditional financial markets also had a strong day: the S&P 500 and the Nasdaq traded near their record highs, supported by the prospect of a meeting between Trump and Xi on September 24, at which a six-month extension of the trade agreement is reportedly on the table. This macroeconomic tailwind coincided with the crypto move and likely provided an additional boost to sentiment.
Important context: despite the rally, Bitcoin remains roughly 31 percent below its all-time high of $126,277 from October 6, 2025. The move is notable, but not a new record, it’s a recovery within a longer downtrend.
Short Squeeze Mechanics: Why Liquidated Positions Are Fueling the Bitcoin Rally
For anyone working with derivatives markets, the mechanics behind this Bitcoin rally are familiar, but rarely so clearly observable. A short squeeze works like a self-reinforcing chain reaction:
- Positioning: Traders open short positions, mostly with leverage, expecting prices to fall.
- Price reversal: The price moves upward against expectations.
- Margin call: Once the price crosses a critical threshold, the margin buffer is no longer sufficient.
- Forced liquidation: Exchanges automatically close the position by buying Bitcoin on the market.
- Amplification: This forced buying pushes the price further up, triggering the next wave of liquidations.
Exactly this effect played out over the past 24 hours: a total of more than $926 million in positions was liquidated, with over 80 percent of that falling on short traders [1][3]. Analysts at Glassnode and Bybit had already noted back in August that a similar rally was driven “almost exclusively” by short liquidations, a pattern repeating itself here [8].
It’s also worth noting that the market had to absorb several macroeconomic shocks simultaneously during this period, including US Federal Reserve interest rate decisions, without the upward move stalling [8]. This suggests that the technical dynamic, pent-up shorts being forced to cover, is currently outweighing individual news events.
ETF Inflows and Institutional Demand as the Foundation of the Bitcoin Rally
A short squeeze alone rarely explains a sustained move. It needs a trigger, or at least accompanying capital that supports the direction. This is where US spot Bitcoin ETFs come into play.
On September 18, these products recorded a net inflow of $433 million in a single day. Fidelity’s FBTC contributed $310.7 million of that, and BlackRock’s IBIT added another $108.4 million. This shows a clear concentration of demand among a handful of large providers.
This concentration is no coincidence. Since its launch, IBIT has become the dominant product in the category and channels a substantial share of the institutional capital flowing into Bitcoin through regulated fund structures [4]. August 2026 marked the strongest month ever for US spot Bitcoin ETF inflows, with billions in new capital that significantly boosted the products’ assets under management [2][7][10].
However, this development wasn’t linear. In early September, flows briefly turned negative, accompanied by a shakier price move, a sign of how closely ETF demand and price dynamics are now intertwined [9][10]. Only with the recent recovery do inflows appear to be picking up again [5].
The relationship can be summarized as follows: ETF inflows create structural demand that stabilizes or lifts prices. When prices rise above critical levels, leveraged short positions come under pressure, and the short squeeze further amplifies the move triggered by the ETFs [4][5].
On-Chain Signals and Strategy Purchases: Is the Trend Confirmed?
Beyond derivatives markets and ETF flows, on-chain data provides a third, independent picture. Several indicators currently point in a constructive direction:

| Signal | Observation |
|---|---|
| 50-week moving average | First close above it in 45 weeks |
| Cost basis models | Bitcoin trading above all relevant on-chain cost basis models |
| Long-term holder selling | Decline from 105,000 to 21,000 BTC per time window, a fifth of the previous level |
| Corporate purchases | Strategy acquired 950 BTC for $76 million, bringing its total holdings to 846,000 BTC |
The decline in selling by long-term holders is particularly telling. It suggests that a large share of market participants who typically take profits are currently holding rather than selling, behavior that in previous market cycles often preceded early recovery phases.
Strategy’s renewed purchase fits this picture, even though a single corporate purchase doesn’t establish a trend for the overall market. More important is the combination of signals: rising price, declining willingness to sell among long-term holders, and a technical breakout above a key moving average.
Outlook and Risks: Leverage, Resistance, and the Limits of the Bitcoin Rally
Despite the positive signals, there are clear warning signs that technical decision-makers should keep an eye on.
Leverage is building back up. Open Interest, the sum of all open derivatives positions, rose 7.6 percent to $156 billion despite the massive liquidation wave. In other words: as soon as the old leveraged positioning is unwound, new leverage is already forming. This raises the risk of renewed, sharp moves in either direction.
Next technical resistance. The 2-year average sits at $88,761 and is considered the next relevant level. A sustained breakout above it would further reinforce the bullish picture, while a failure could instead lead to a quick correction back into the previous trading range [3].
ETF flows are volatile. As the brief outflows in early September showed, institutional inflows can reverse within a matter of days. Since a significant share of current demand runs through a handful of large ETF products, the market is sensitive to sentiment shifts among this group of investors [9][10].
The cycle debate. Analyst Checkmate declared the classic 4-year cycle “dead,” a thesis gaining increasing traction as institutional ETF structures and corporate purchases shape market behavior more strongly than earlier halving-driven patterns. However, this assessment remains an interpretation, not an established fact.
“The 4-year cycle is dead,” a thesis that underscores the shift in market structure, but one that doesn’t go unchallenged.
For systems that model price risk, the combination of rising Open Interest and a nearby technical resistance level is a reason to calibrate position sizes and liquidation thresholds more conservatively, rather than blindly extrapolating the current Bitcoin rally.
Altcoin Rotation: Capital Flows into Alternatives
Alongside the Bitcoin rally, a classic pattern is emerging: capital is increasingly rotating into altcoins. Dogecoin led the move with a gain of 15 percent. Such an “altcoin season signal” often occurs when investors diversify profits after a strong Bitcoin move or bet on a broader market rally.
Caution is warranted when assessing this rotation: altcoin movements are typically more volatile than Bitcoin itself and react more strongly to short-term sentiment swings. They should be viewed as a complementary signal to Bitcoin’s dynamics, not as a standalone trend with guaranteed continuation.
Conclusion
The Bitcoin rally to $87,500 has a clear explanation: pent-up short positions between $82,000 and $86,000 were forcibly liquidated during a price breakout, which itself amplified the surge. This move was supported by structural demand from US spot Bitcoin ETFs, constructive on-chain data, and a technical breakout above the 50-week moving average.
At the same time, the market remains fragile: new leverage is already building up again, a key resistance level just below $88,800 is imminent, and ETF flows have already briefly reversed once in the recent past.
For technical decision-makers and developers managing trading or risk systems, concrete next steps follow: integrate Open Interest data and liquidation feeds into existing monitoring dashboards, adjust margin alert thresholds to current volatility, and factor ETF flow data into pricing models as an additional leading indicator. This article does not constitute financial advice, but rather a factual assessment of the available market data.
References
[1] Bitcoin Tops 85000 For The First Time Since January In A Short Squeeze – https://startupfortune.com/bitcoin-tops-85000-for-the-first-time-since-january-in-a-short-squeeze/ [2] Bitcoin Etf Inflows August 2026 – https://www.altcoinbuzz.io/bitcoin-etf-inflows-august-2026 [3] Bitcoin Short Squeeze 80000 83000 Next 20260920j1418 – https://www.mitrade.com/insights/crypto-analysis/bitcoin/bitcoin-short-squeeze-80000-83000-next-20260920J1418 [4] Bitcoin Etf Flows Ibit Institutional Demand 2026 – https://www.vaasblock.com/news/bitcoin-etf-flows-ibit-institutional-demand-2026/ [5] Why Bitcoin Etfs May Be Worth Another Look As Inflows Rebound – https://www.marketbeat.com/articles/why-bitcoin-etfs-may-be-worth-another-look-as-inflows-rebound/ [6] bitget – https://www.bitget.com/news/detail/12560605773367 [7] Us Bitcoin Etfs August Inflows 2026 – https://pro.edgex.exchange/en-US/news/article/us-bitcoin-etfs-august-inflows-2026 [8] Bitcoins Sharpest Rally Two Years 160103232 – https://finance.yahoo.com/markets/crypto/articles/bitcoins-sharpest-rally-two-years-160103232.html [9] Us Spot Bitcoin Etfs Added B In August As Assets Rose To B Then Saw M Outflow On Sept – https://bingx.com/en/flash-news/post/us-spot-bitcoin-etfs-added-b-in-august-as-assets-rose-to-b-then-saw-m-outflow-on-sept [10] Bitcoin Etfs Record Strongest Month Of 2026 In August Face Outflows In September – https://www.kucoin.com/news/flash/bitcoin-etfs-record-strongest-month-of-2026-in-august-face-outflows-in-september
Frequently Asked Questions
What caused the Bitcoin rally to $87,500?
A short squeeze triggered by the price breaking above the $82,000–$86,000 range where numerous short positions had accumulated, forcing over $926 million in liquidations, more than 80% of it short positions.
How much did Bitcoin's price rise?
Bitcoin jumped roughly 10 percent to an intraday high of $87,374, the highest level since the end of January 2026.
How much money flowed into Bitcoin ETFs?
US spot Bitcoin ETFs recorded net inflows of $433 million on September 18 alone, led by Fidelity's FBTC ($310.7 million) and BlackRock's IBIT ($108.4 million).
Is Bitcoin at a new all-time high?
No. Despite the rally, Bitcoin remains roughly 31 percent below its all-time high of $126,277 from October 6, 2025.