



A $20 billion hole just opened up in one of the most important numbers in tech. At the same time, nearly 30,000 bitcoin moved onto exchanges at a loss in a single day. These are not separate stories. They are two symptoms of the same disease: markets built on debt and projections that are now being forced to confront reality. The phrase "Bitcoin correction AI debt bubble" has started circulating among traders and analysts for a reason, the forces pushing crypto prices down and the forces inflating AI valuations are increasingly tangled together.
This article breaks down what happened with OpenAI's reported revenue, why Goldman Sachs is tracking half a trillion dollars in AI-related debt, and how that connects to the sharp Bitcoin correction playing out this week. It also looks at on-chain capitulation signals that suggest short-term holders are panicking, and why that historically, though not always, lines up with local price bottoms.
Key Takeaways
- OpenAI's actual annualized revenue run-rate is about $50 billion, roughly $20 billion (about 29%) below the nearly $70 billion figure reported days earlier, according to the Financial Times, as flagged by analyst FurkanCCTV on X.
- Goldman Sachs estimates roughly $500 billion in AI-related debt has already been raised in 2026, with more than $750 billion expected by year-end.
- Bitcoin has swept major liquidity clusters on the 7-day heatmap, and on-chain analyst RobynHD reported close to 30,000 BTC sent to exchanges at a loss by short-term holders within 24 hours, a classic capitulation signal.
- Rising US Treasury yields are a key driver of risk-asset selling, pressuring both tech valuations and Bitcoin simultaneously.
- Capitulation spikes often precede local lows, but RobynHD cautions the correction may continue if bond-market pressure keeps building.
The OpenAI Revenue Gap: A Crack in the AI Debt Bubble Narrative
For months, OpenAI's revenue figures have served as a kind of scoreboard for the entire artificial intelligence industry. Investors, analysts, and competitors all watch the company's numbers as a proxy for whether AI demand is real or overstated. That is exactly why the latest correction matters so much.
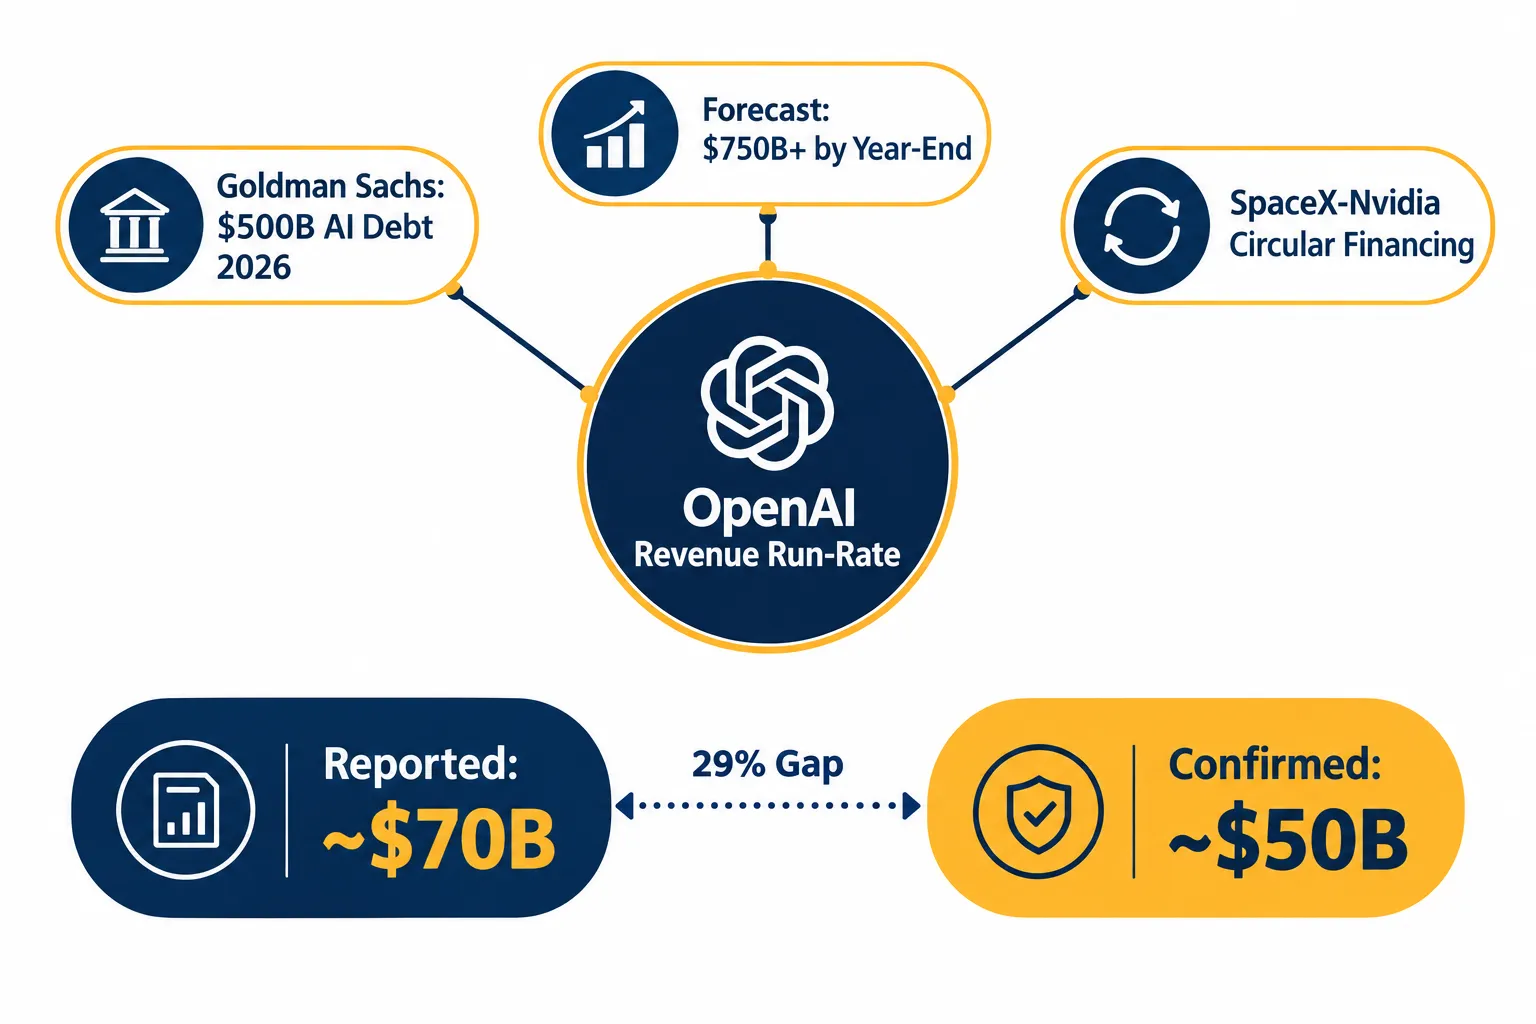
According to the Financial Times, OpenAI told its investors that its annualized revenue run-rate stood at just under $50 billion at the end of September. Just days earlier, media reports, also based on information given to investors, had put the figure near $70 billion. As analyst FurkanCCTV reported on X, the gap between those two numbers equals roughly 29% of the originally reported figure, or about $20 billion.
The explanation, per the FT, is not fraud or a sudden business collapse. It appears to be a methodology mismatch. OpenAI's own investors reportedly wanted to make the company's revenue comparable to rival Anthropic. Anthropic counts revenue booked through cloud partners like Amazon and Google as part of its own totals. OpenAI does not count that revenue the same way. So investors apparently grossed up OpenAI's reported number to make the comparison look cleaner, inflating the headline figure in the process. OpenAI declined to comment on the discrepancy.
Why does an accounting disagreement matter this much? Because, as the FT noted, this revenue metric, combined with Anthropic's, is treated as the single most important gauge of overall AI demand. Decisions about data center construction, chip orders, and a meaningful share of stock market valuation gains are built on the assumption that this demand is real and growing. When the number being used to justify those decisions turns out to be inflated by nearly a third, it raises uncomfortable questions about everything stacked on top of it.
How the Debt Pile Connects to the Bitcoin Correction AI Debt Bubble Story
The revenue gap would be a footnote if it weren't tied to actual borrowed money. According to Goldman Sachs, roughly $500 billion in AI-related debt has already been raised in 2026 alone. The bank expects that figure to exceed $750 billion by the end of the year.
That debt does not float. It sits on company balance sheets in fixed dollar amounts, due on fixed schedules, regardless of how demand evolves. FurkanCCTV's earlier reporting highlighted a vivid example: SpaceX reportedly wants to borrow $40 billion to purchase Nvidia chips, while Nvidia itself is a major shareholder in SpaceX. As FurkanCCTV put it, "the money runs in a circle." Notably, SpaceX's 2056 bonds have been trading around 85 cents on the dollar, carrying a risk premium closer to junk-bond territory despite the company holding an investment-grade rating, a sign that bond markets are already pricing in some uncertainty about future cash flows.
Put simply: huge amounts of debt have been raised on the assumption that AI revenue will keep climbing at an extraordinary pace. If the underlying revenue numbers turn out to be smaller than advertised, the gap between debt obligations and actual cash generation widens. That is the essence of what commentators mean when they describe a possible AI debt bubble.
Bitcoin Correction AI Debt Bubble Link: Rising Yields Squeeze Risk Assets
While the AI revenue story was unfolding, Bitcoin was going through its own stress test. On-chain analyst RobynHD noted on X that Bitcoin had "swept" the liquidity resting on the 7-day heatmap, a technical way of saying that clusters of stop-loss and liquidation orders sitting just below recent lows had been triggered and cleared out.
But RobynHD was careful to point out where the pressure was actually coming from: traditional financial markets, not crypto-native dynamics. US bond yields, after a brief pullback, resumed climbing toward further multi-year highs. Rising yields make bonds more attractive relative to riskier assets, and they increase the cost of capital across the economy. Bitcoin, as a liquid, 24/7-traded risk asset, tends to feel that pressure quickly and directly.
| Pressure Point | What's Happening | Why It Matters |
|---|---|---|
| US Treasury yields | Rising toward multi-year highs | Pulls capital toward safer, higher-yielding bonds |
| AI revenue questions | OpenAI run-rate ~29% below prior reports | Undermines confidence in AI valuation growth |
| AI-related debt | ~$500B raised in 2026, ~$750B+ expected | Fixed obligations regardless of actual demand |
| Bitcoin liquidity | 7-day heatmap clusters swept | Removes nearby support, invites more volatility |
RobynHD was explicit that sweeping those liquidity clusters does not guarantee the correction is finished. If selling pressure from bond markets keeps intensifying, Bitcoin can continue falling even without obvious liquidity targets below current price. In other words, the chart alone won't settle this, macro conditions will.
Capitulation Signals: Is the Bitcoin Correction AI Debt Bubble Pressure Near a Peak?
Beyond the heatmap analysis, RobynHD flagged a second, arguably more telling signal: realized losses. According to the same on-chain analysis, selling pressure during this correction has been strongly spot-driven, meaning actual coins are changing hands rather than just leveraged positions unwinding.
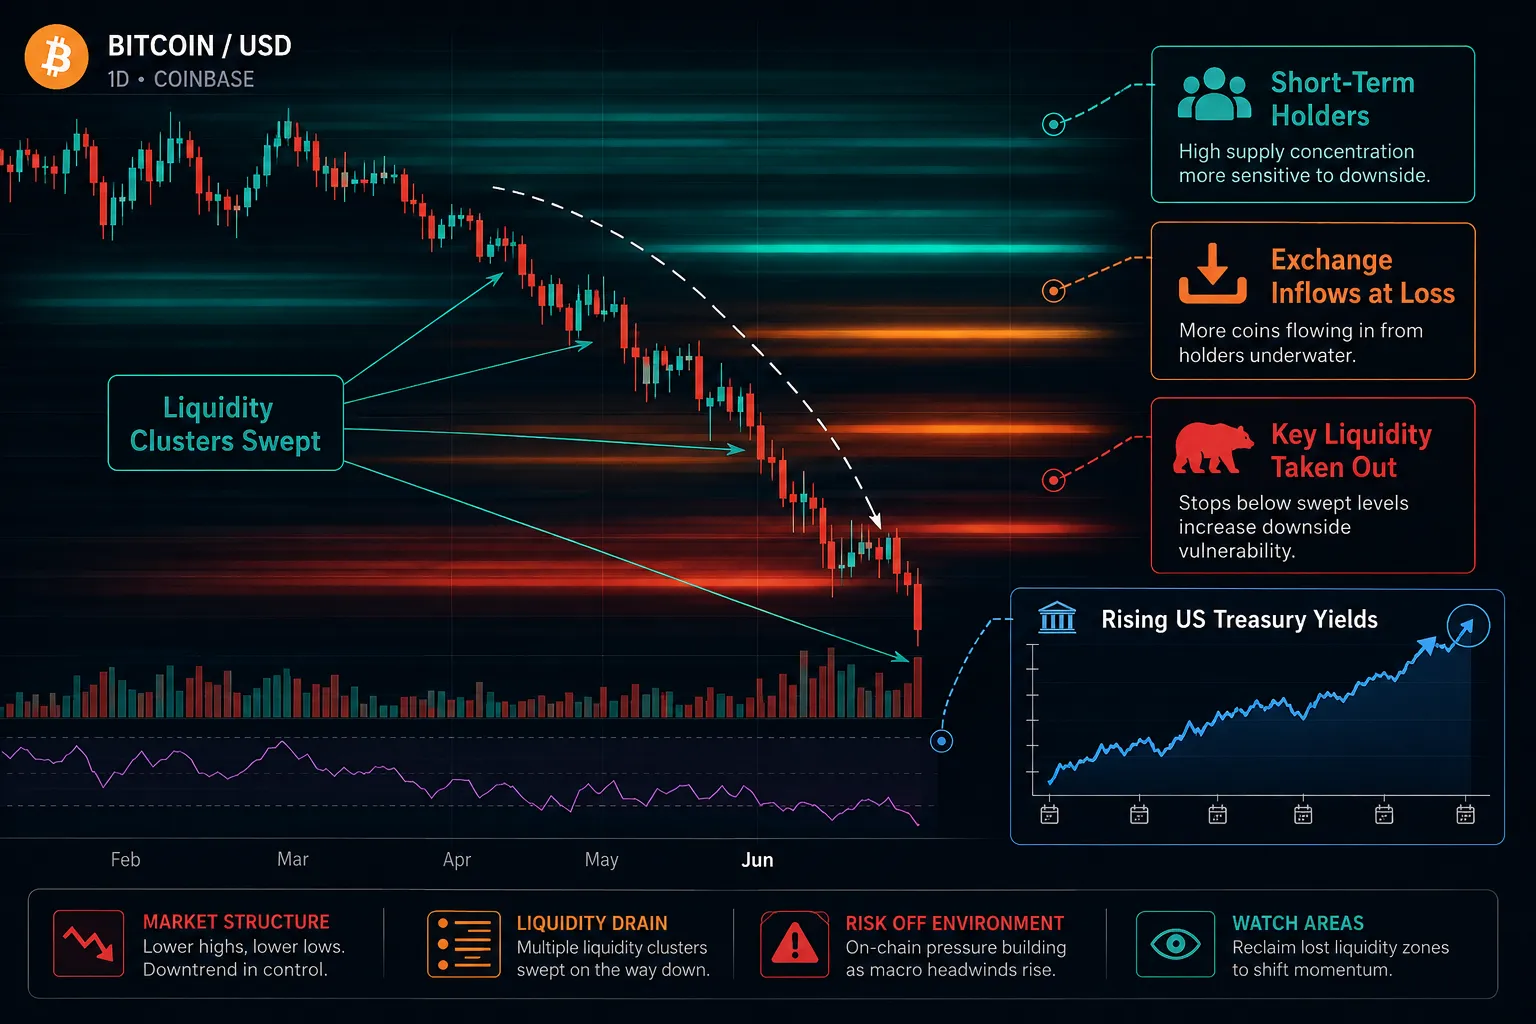
At the most intense point, nearly 30,000 bitcoin were transferred to exchanges by short-term holders at a loss within a single 24-hour window. That is a sharp spike, and it points to a specific group of market participants: people who bought in recent weeks or months and are now seeing their positions underwater.
A few important clarifications from the data itself:
- A transfer to an exchange does not automatically mean a sale has occurred.
- Extreme spikes in loss-making transfers have historically appeared during periods of high uncertainty.
- Such spikes have not infrequently coincided with local price lows, though this is a pattern, not a rule.
This nuance matters. Capitulation spikes reflect panic and exhaustion among recent buyers, not necessarily a confirmed turning point. RobynHD's framing is deliberately cautious: the signal is notable, but it does not override what is happening in bond markets. As long as Treasury yields keep climbing and risk aversion keeps building, Bitcoin's correction can extend further regardless of how washed-out short-term holders already appear.
Why These Two Stories Are Really One Story
It is tempting to treat the OpenAI revenue gap and the Bitcoin correction as unrelated headlines that simply happened to land on the same day. Looking closer, they share a common thread: both are stress tests of whether real-world cash flows can support the valuations and debt loads built on top of them.
The AI sector has attracted enormous capital on the assumption that revenue growth will keep pace with spending on chips, data centers, and infrastructure. The OpenAI figures, a run-rate nearer $50 billion rather than the previously cited $70 billion, chip away at that assumption. Combine that with hundreds of billions in debt already raised, and circular financing arrangements like the SpaceX-Nvidia example, and the picture that emerges is one where confidence, not just cash, is doing a lot of the load-bearing work.
Bitcoin, meanwhile, trades as a highly liquid barometer of broader risk appetite. When bond yields rise and doubts about tech valuations spread, capital tends to retreat from both corners of the market at once. That is the mechanism linking a corporate accounting dispute in San Francisco to liquidations on crypto exchanges worldwide. Neither story caused the other directly, but both are being driven by the same underlying shift: investors demanding more certainty before committing capital to assets priced for perfection.
What History Suggests About Capitulation and Bottoms
Markets rarely move in straight lines, and sharp capitulation events have historically marked turning points often enough to get attention, but not often enough to be treated as guarantees. A few patterns worth noting:
- Capitulation spikes tend to cluster around periods of acute uncertainty, not calm markets.
- They often reflect the exhaustion of short-term, recently entered buyers rather than long-term holders giving up.
- They can mark local lows, but broader macro trends, like a sustained rise in bond yields, can override short-term on-chain signals.
- Liquidity-cluster sweeps clear out nearby order flow but say nothing about what happens next if new selling pressure arrives.
Taken together, these patterns support a measured read: the current signals are meaningful, but they are not a green light. The next move likely depends more on what happens in Treasury markets and AI-sector financing than on anything visible purely in crypto order books.
Conclusion
The Bitcoin correction and the AI debt bubble conversation are converging for a reason. OpenAI's revenue run-rate coming in roughly $20 billion, or about 29%, below earlier reports, as surfaced through FT reporting and highlighted by analyst FurkanCCTV, undercuts the demand story behind hundreds of billions in AI-related debt. At the same time, on-chain analyst RobynHD's data shows Bitcoin absorbing real selling pressure, with liquidity clusters swept and nearly 30,000 BTC moved to exchanges at a loss by short-term holders in a single day.
Neither signal, on its own, predicts exactly what happens next. Rising Treasury yields remain the dominant force pressuring both AI-linked equities and Bitcoin. Readers tracking this environment should watch three things closely: upcoming bond yield movements, any further disclosures about AI company revenue and debt servicing, and whether Bitcoin's on-chain capitulation metrics stabilize or continue climbing. This article is for informational purposes only and does not constitute investment advice.
Frequently Asked Questions
What is the OpenAI revenue gap about?
OpenAI reportedly told investors its annualized revenue run-rate was just under $50 billion at the end of September, roughly $20 billion below an earlier reported figure near $70 billion, due to differing methods of counting cloud-partner revenue compared with Anthropic.
How much AI-related debt exists in 2026?
According to Goldman Sachs, approximately $500 billion in AI-related debt had been raised in 2026 as of early October, with more than $750 billion expected by year-end.
What does "liquidity swept" mean for Bitcoin?
It means clusters of stop-loss and liquidation orders below recent price lows on a heatmap have already been triggered, removing those specific price levels as near-term targets, though it does not guarantee the correction is over.
Is 30,000 BTC moved to exchanges a sell signal?
Not necessarily a confirmed sale, but a transfer of that scale by short-term holders at a loss is historically associated with capitulation phases, which sometimes, not always, coincide with local price lows.
References
- Financial Times, via analyst FurkanCCTV on X, Oct 8, 2026, https://x.com/furkancctv/status/2108239788465676324
- FurkanCCTV on X, SpaceX/Nvidia debt thread, Oct 7, 2026
- RobynHD on X, Bitcoin liquidity heatmap analysis, Oct 8, 2026, https://x.com/robynhd/status/2108224612211544157
- RobynHD on X, short-term holder exchange inflow analysis, Oct 8, 2026, https://x.com/robynhd/status/2108229018810294298